Run 01 · Markets & Capital · field test
Treasury: five Fiscal Data reads and a projection that knows when to stop
We asked Treasury's API the desk's five questions, then set the answers beside Treasury's dataset page, its debt guide and FRED.
Brief
What it is, and who it is for
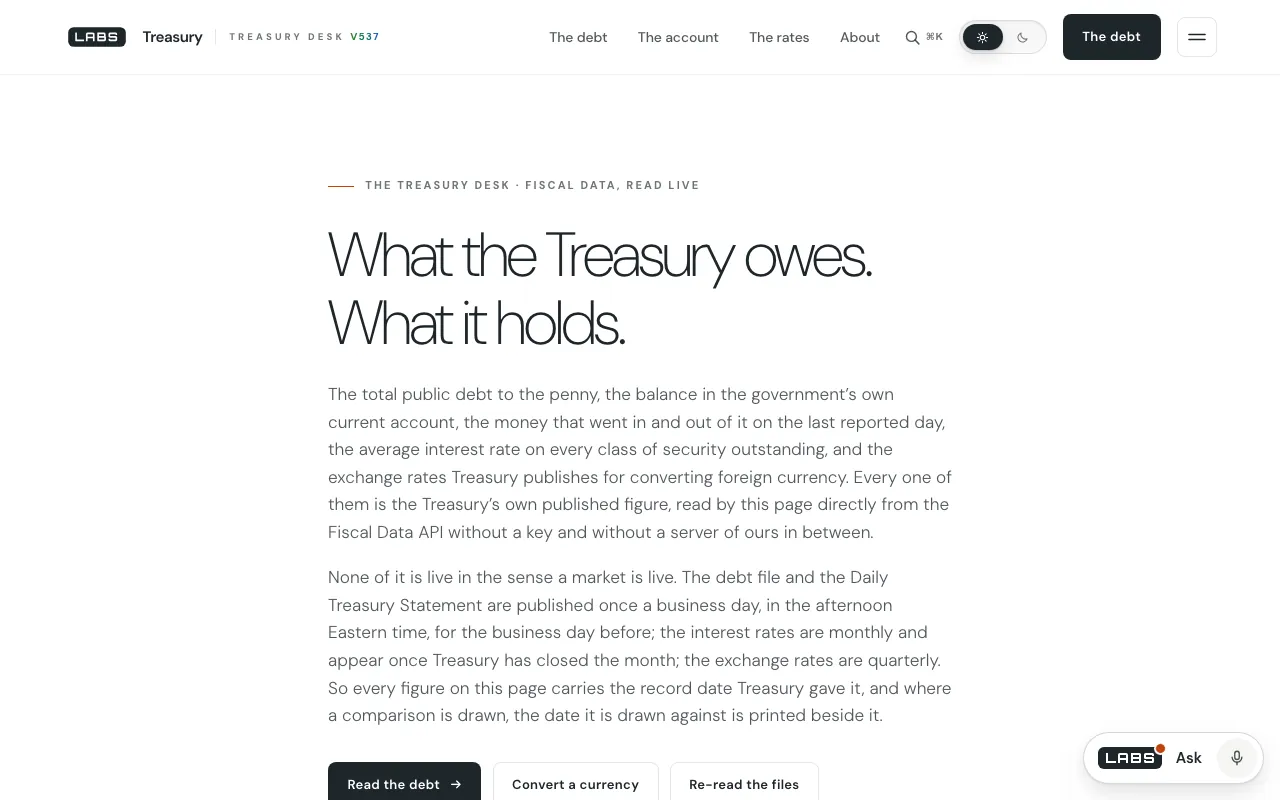
The Treasury desk is one page that shows what the federal government owes and what it holds, using only figures the Bureau of the Fiscal Service publishes: the total public debt to the penny with a year of it charted, the Treasury General Account's cash balance over ninety business days, the day's deposits and withdrawals, average interest rates by security, and quarterly exchange rates.
It is for readers, reporters and students who want the government's own numbers with their record dates, without a spreadsheet or an API key.
Wiring
Where the work happens
No labs server stands between the reader and Treasury. The script makes five requests from the browser to api.fiscaldata.treasury.gov, each uncached, with a twenty-second timeout and a check that the reply really holds data (app.js 37, 408–431). It re-reads every thirty minutes while the tab is visible.
Sources it reads
- Fiscal Data API, U.S. Treasury Bureau of the Fiscal Service —
debt_to_penny,operating_cash_balance,deposits_withdrawals_operating_cash,avg_interest_ratesandrates_of_exchange.
Run table
The run, row by row
| # | Time | Probe | Returned |
|---|---|---|---|
| 01 | Loaded the desk from the local build-537 copy | HTTP 200, 52,365 bytes of static HTML. | |
| 02 | Asked debt_to_penny for its two newest records, with the desk's own fields | 24 Sep 2026: $40,068,807,991,924.84. 23 Sep: $40,073,558,531,201.68. The debt fell about $4.75bn in a day. | |
| 03 | Asked the operating-cash table for four rows | Closing TGA balance 924,627 ($m) was carried in open_today_bal; close_today_bal read "null" on every row. | |
| 04 | Asked deposits and withdrawals, filtered to Treasury's two total lines | 24 Sep: deposits 278,110; withdrawals 300,800 ($m). | |
| 05 | Asked interest rates and the newest exchange-rate quarter | Rates to 31 Aug 2026, 16 rows. Exchange: quarter to 30 Jun 2026, 174 currencies. | |
| 06 | Rebuilt the ninety-day rate from 273 debt records | About +$94,046 a second, measured from $39,337,503,706,976.53 on 26 Jun 2026. | |
| 07 | Read Fiscal Data's Debt to the Penny pagerival page | Series from April 1993; CSV, JSON and XML; next release expected 28 Sep 2026. | |
| 08 | Read America's Finance Guide on the national debtrival page | Definitions, debt-to-GDP charts, linked history back to 1790. | |
| 09 | Read FRED's series GFDEBTNrival page | Quarterly, end of period; latest Q1 2026 at $39,065,421m, updated 18 Jun 2026. |
Findings
The lengths it goes to
- The ticking debt figure is labelled a projection, its speed measured over ninety days, not one. The source says why: on 19 August 2026 a one-day change implied the debt was shrinking by $401,912 a second while longer windows showed it growing. Our session met the same trap — a one-day fall of $4.75bn — and the ninety-day window still read a rise.evidence · app.js 648–665, 691; run rows 02 and 06
- The projection switches itself off when Treasury's newest record is more than ten days old, and says why on the page.evidence · app.js 702–716
- It takes the closing cash balance from the field Treasury actually fills; the one named for it returned the string "null" in our read.evidence · app.js 776–789; run row 03
- Exchange rates are fetched as a whole quarter in two steps, so a page-size limit cannot quietly drop currencies.evidence · app.js 1229–1250; 174 rows in run row 05
- Charts take keyboard focus and answer the arrow keys; no figure exists only as pixels.evidence · app.js 437–441, 508–543; index.html 579
Against the field
Set beside 3 rivals
Fiscal Data — Debt to the Penny
Treasury's own page for the daily debt series: a data preview, date filters, downloads, a data dictionary and API notes.
Where it is ahead
- The primary source, back to April 1993.
- CSV, JSON and XML files with a data dictionary, and the next release date.
Where the labs desk goes further
- Five datasets on one page, each with its record date.
- A labelled, self-stopping projection, and the cash table's "null" field resolved.
America's Finance Guide — National Debt
Treasury's plain-language explainer of the debt, with charts and history.
Where it is ahead
- It explains why the debt grows, with debt-to-GDP framing and history back to 1790 — context the desk never attempts.
Where the labs desk goes further
- Current daily records, re-read half-hourly, plus the day's cash flows and a currency converter.
FRED — Federal Debt: Total Public Debt
The St. Louis Fed's page for the series.
Where it is ahead
- Custom charts, embeds and email notifications.
- Past vintages through ALFRED, and related series.
Where the labs desk goes further
- Daily figures to the penny (24 Sep in our session) against quarterly data (Q1 2026 on FRED that day).
Faults
Where it falls short
- No data download. The only export is a PNG; Fiscal Data hands you CSV, JSON, XML and a dictionary.
- Short memory: about thirteen months of debt and ninety business days of cash; Fiscal Data reaches back to 1993.
- Figures are at least a business day old, and the exchange rates are quarterly reporting rates nobody can deal at, as the page warns.
- A stale comment (app.js 628–632) still says the rate comes from the file's last two records, contradicting the ninety-day window the code uses.
Sign-off
Log closed at
- Held up
- All five reads answered, and the data held exactly the one-day fall the ninety-day window was written to see past.
- Fell short
- No raw data to take away, and little history.
- Reach for it when
- You want debt, cash, daily flows, rates and exchange rates in one current view, each with its record date.
- Look elsewhere when
- You need long history or a file — Fiscal Data or FRED.